At Magnet.me we try to measure and log everything. We use it to get a better understanding of our customers and our software. We already had Kibana and Logstash in place, but we were still missing some functionality to cover all our metric needs. We ended up trying InfluxDB and Grafana as our main tooling. In this blog post, we'll tell you how to try it out yourself, and why you should give it a shot.
Why measure
There are tons of great blogs about measuring so I’ll just say a few words about our aproach.
At Magnet.me we use OKRs. In short, it means we set quarterly objectives and we validate if we achieve them by setting measurable goals for ourselves. This implies that we need to be able to measure everything we build. Often this concerns how users use our product.
For example, when we try to get costumers to respond to a message 15% more often, we might choose to change the email we send them, or change user they way the reply button looks on our website. To measure the result of these changes we first need to know how many users used to go to the reply page, and from where. Then we try new versions of the email, add buttons to reply on the website, or change the buttons we already have. We then measure the difference. If we achieve our goal, we move on to the next goal. If we fail, we adjust our strategy. By doing this rapidly in a loop until we reach our goal, or decide it can’t be reached, it is easy for us to keep our focus and not falsly assume something is fixed because we put some effort in.
To achieve this, we need a bunch of metric tools. One that:
- measures how users navigate through our site. We use Google Analytics for this.
- allows us to A/B test. We also use Google Analytics for this if it is a test happening in the browser.
- tracks clicks in the email to the desired state, including the time it took the user to respond.
For the last job, logging the time it took to go to the state, we did not have a great solution yet. We used to just log it and then query it with Kibana, but that had a couple of downsides. Kibana 3 (at the time) could only show one dashboard per index. Also, you cannot annotate graphs in Kibana, so marking when you launched an experiment is not possible.
Why InfluxDB
When we started to look for a metric database, you soon find out you need a Time series database. It seems like most developers are using the StatsD + Graphite stack for this. However, I never liked the UI of Graphite so we decided to use Grafana instead. On the Grafana site we ran into a great tool called InfluxDB. InfluxDB has a couple of design goals I like in comparison to the design of StatsD:
- It’s horizontally scalable
- Besides metrics, it also stores events
- It stores on disk and in-memory.
- Expand storage by adding servers to a cluster. Should make node replacement quick and easy.
- Automatically compute common queries continuously in the background.
Setting it up
Assuming you have Docker (or boot2docker if you’re on a mac) installed, we kick off by starting up an InfluxDB instance:
docker run -d -p 8083:8083 -p 8086:8086 -e PRE_CREATE_DB="db1" --name=influxdb tutum/influxdb
This will fire up the admin dashboard on port 8083 and the API on 8086. We set it up to pre-create the database db1 for testing purposes. Open http://localhost:8083 or on mac open http://$(boot2docker ip):8083. Login with username and password root. You don’t have to populate the database. You should see our db1 in the list. Good, now we’re ready to send some data!
At this point, I recommend following the steps in the InfluxDB Getting Started Guide. They have a piece of JavaScript you can run to insert a bunch of data points. Take your time to go through the introduction and insert that data. Go on. I’ll wait.
Grafana
Now that you’ve played around with Influx a little it’s time to sprinkle a little of that Grafana magic on top. Pop back into your terminal and fire up a grafana instance:
docker run -d -p 80:3000 --link=influxdb:influxdb grafana/grafana:2.0.2
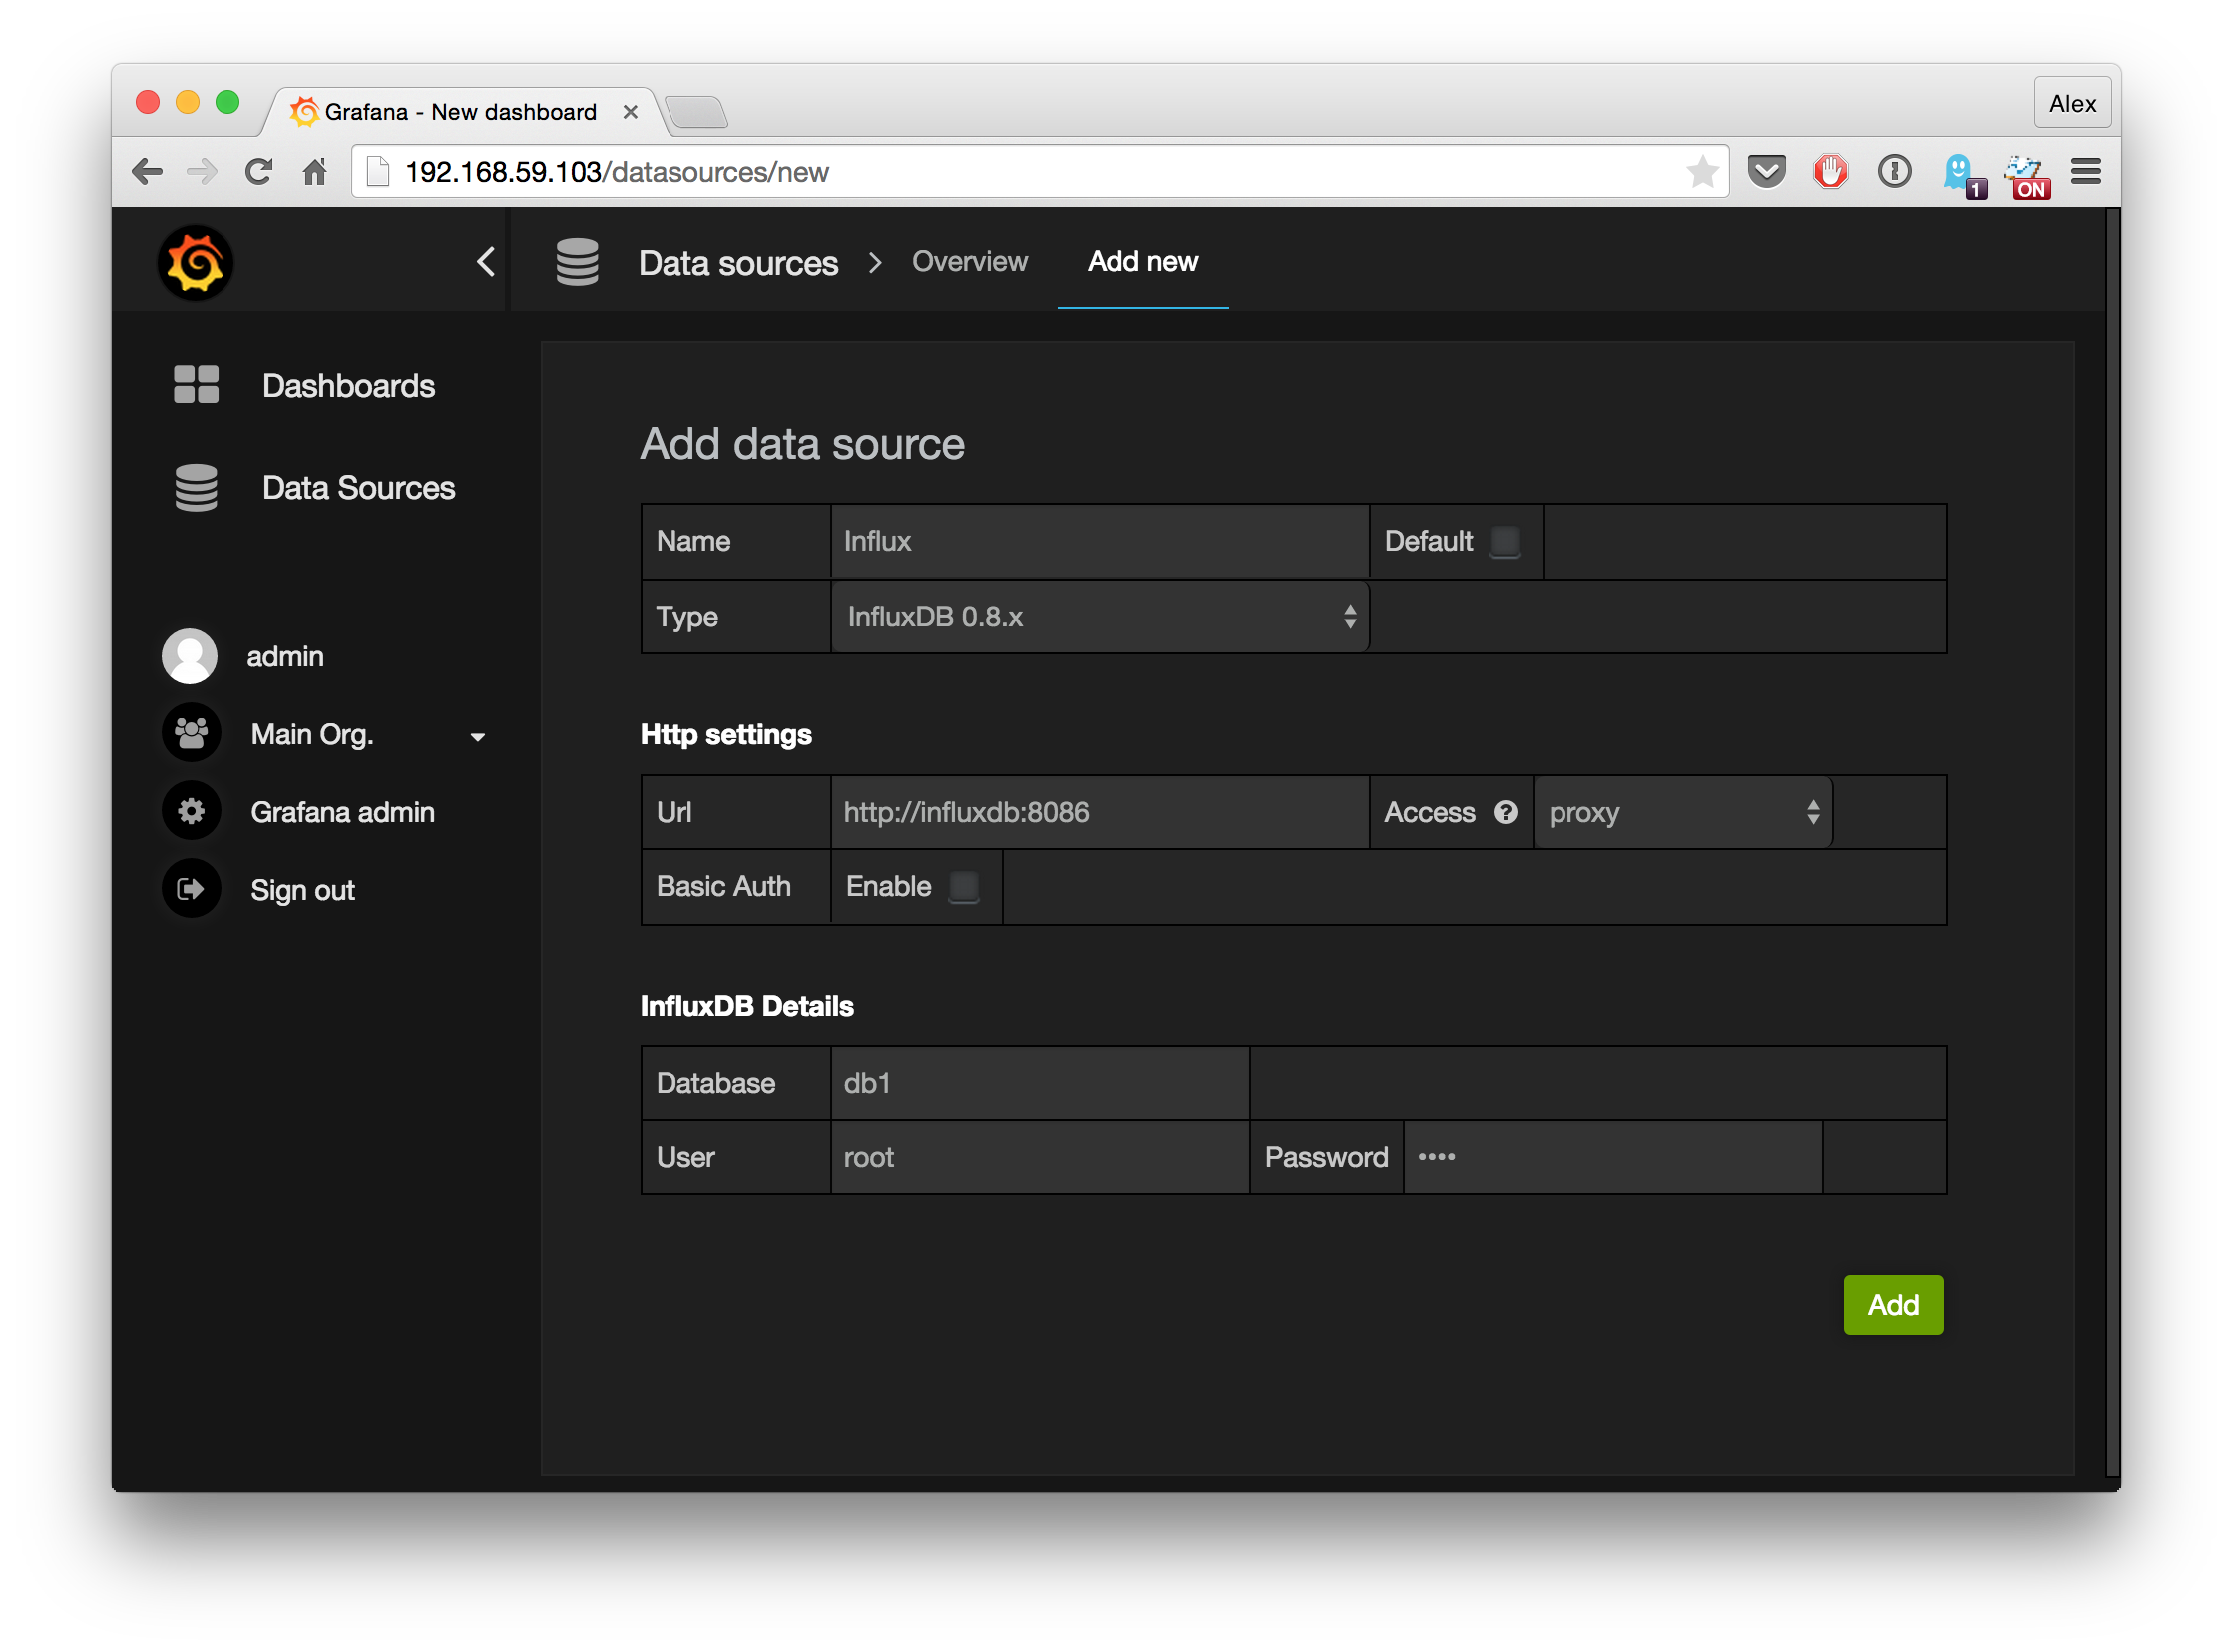
Then open http://localhost or on mac open http://$(boot2docker ip). Login using using username and password “admin”, click the Grafana logo on the top-left, and go to “Data Sources”, “Add New”. Here we’ll fill
in our influx database. Because we linked the containers using --link=influxdb:influxdb the Grafana instance (which proxies the HTTP requests) can reach influx at http://influxdb:8086 (the port for the API). We’ve set-up the influx database with username/password “root” and our database is called “db1”. Let’s just call the datasource “Influx”.
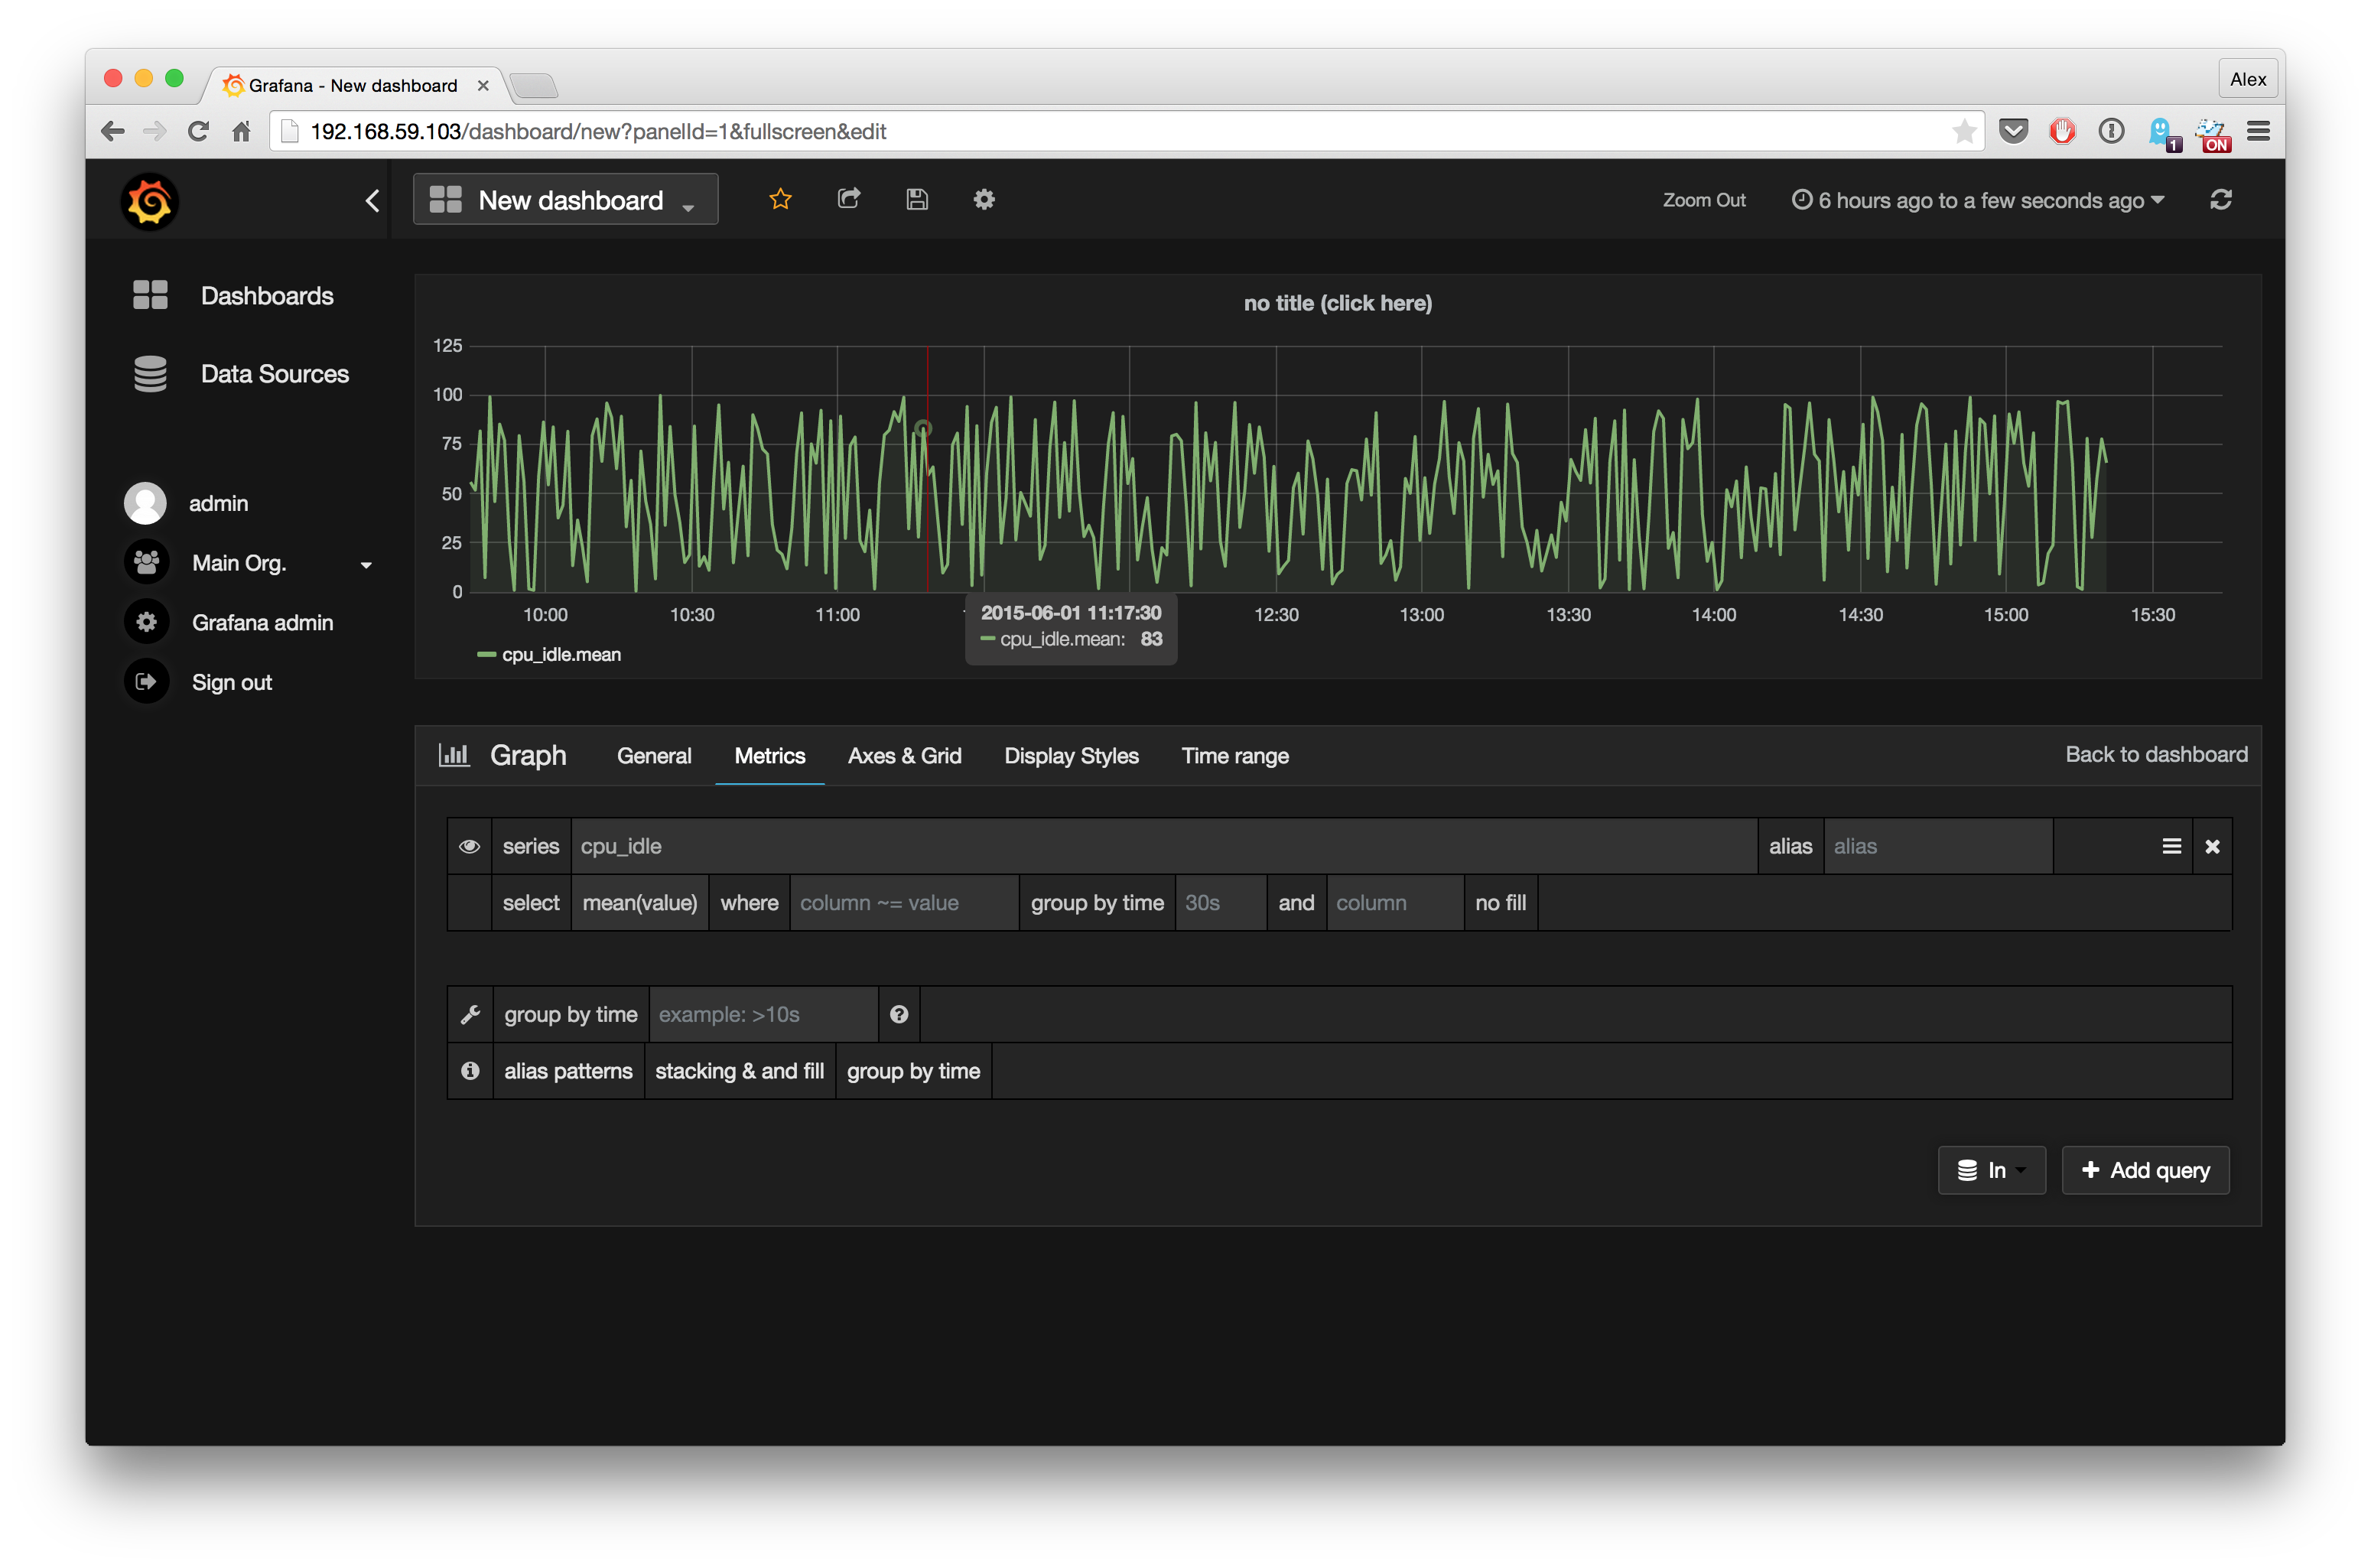
Now that we have a datasource, let’s create a new dashboard from the dashboard menu. Then click the little green button on the left and press “Add Panel” > “Graph”. Grafana will show a fake graph to give you an impression, but we want our data from influx. Click on the title of the graph and press ‘edit’. Select “Influx” as our data source. In the InfluxDB Getting Started Guide you have created two series: cpu_idle and customer_events. Let’s use the former one for this graph. If you’ve set it up correctly you should now see your first Grafana chart!
Final remarks
- In production, we found out that Raft doesn’t like docker changing ids all the time. To circumvent this, overwrite the config to set a steady id using the
hostnamevariable. - We used Influx 0.8 and Grafana 2.0.2